
Choose your preferred lottery agent below

![]()

World lotteries by size of their highest ever jackpot (in £m)
 Here's our comparison of the biggest ever jackpots by lottery. This first chart compares them, apples with apples, in the one currency whereas the next chart to the right (or below on mobile!) shows the highest jackpot values in their local currency.
Clearly, the record still to beat is the US Powerball though the Megamillions is not far off.
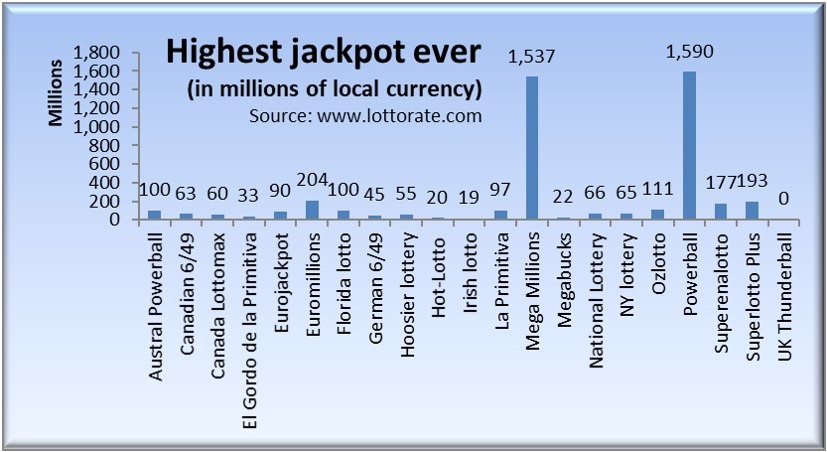
World lotteries by size of their highest ever jackpot (mill. of local currency)
The only downside to this latest Powerball jackpot is that it is now even harder to get people excited when a jackpot reaches a mere few hundred million. Good news for the jackpot hunters mind, as they will face better chances of not sharing these big jackpots in the future.
Target jackpot size for world lotteries to achieve positive RTP
RTP or Return to Player is the measure of what value of all stakes is returned to players when they play a lottery. If you remember, especially from our detailed reviews of each lottery, this will vary by lottery and also by draw. Most lotteries are set up to return a fairly low 50-60% 'of stakes as 'standard'. This means that for every dollar or pound we spend, the lottery organisation aims to keep 50c or 50p etc. It is a fair chunk to be sure especially when compared to some other gaming products. But lotteries do tend to transfer a large portion of this cash over to the good causes. Their margin is what goes into state coffers to fund education etc, or is distributed to charities in some manner. Sadly, they don't run lotteries to make us money! Yet.... sometimes, their jackpots do get to the level where their value plus the value of all other prizes, if they're all paid out, are worth more than the sum of all the stakes on that draw. This is positive RTP, or at least the basis for positive RTP.
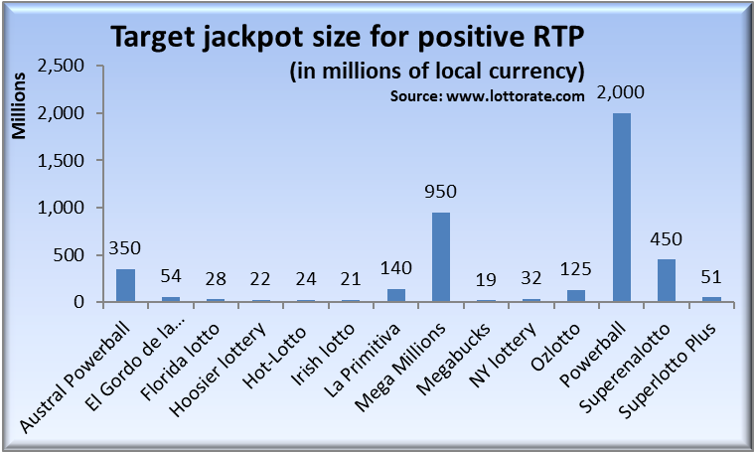
Yet.... sometimes, their jackpots do get to the level where their value plus the value of all other prizes, multiplied by the likelihood of their being won, are worth more than the sum of buying one of each ticket. This is positive RTP, or at least the basis for positive RTP.
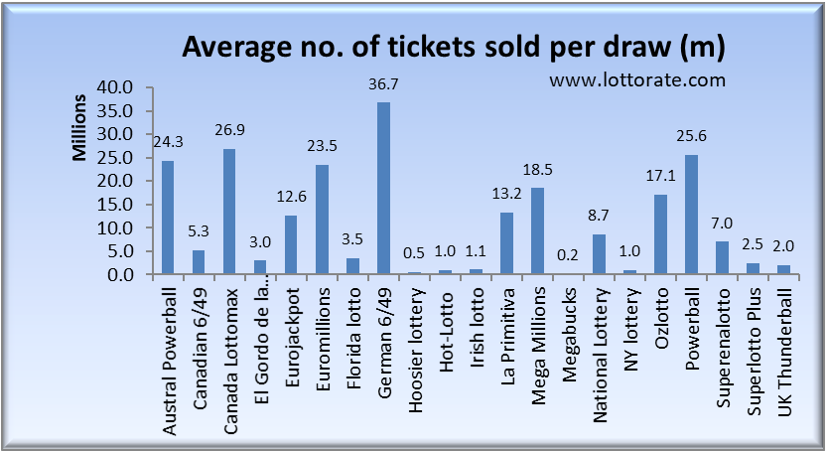
Average ticket sales per draw by lottery
Ticket sales ebb and flow depending on the size of the jackpot, day of the week and even the time of year. We have attempted to calculate an 'average' by lottery here. It's not 100% accurate but won't be far off. Whilst the US Powerball hit 600,000 tickets in one draw, on an average draw, the German Lotto 6 aus 49 is number 1. For a better understanding of ticket sales by lottery, see the individual Lotto review pages.
Average ticket sales per capita per draw by lottery
We thought it might be interesting, not only to see which lottos were the biggest but how this compared to the populations where those lotteries were offered. Note that this chart does not look at total sales of an organisation's draws and games but just the relevant lotto itself.

You might get the impression from this that the New York Lottery organisation isn't doing too well versus some other Lottery operators. This isn't the case - they do in fact perform very well in terms of overall sales. What they don't do so well here, in this example, is run a good state 'Lotto' product.
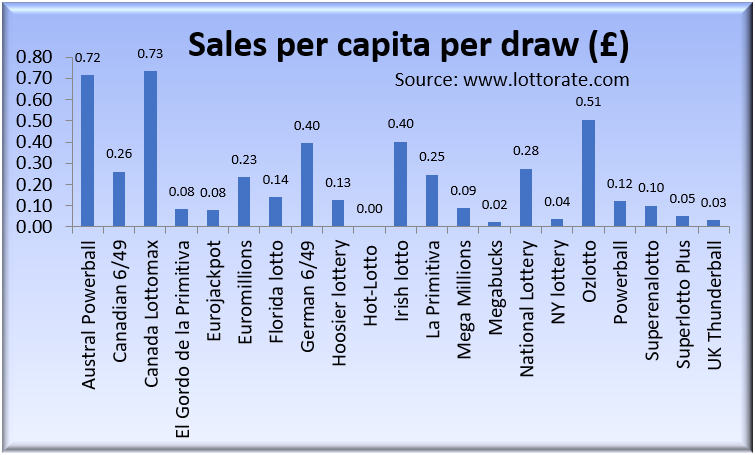
Average sales per capita per draw by lottery
Simlar to the tickets chart above, this graph takes the analysis one step further and discounts the cost of tickets. As you will have noticed on the individual Lotto review pages, the cost of a lotto ticket can vary considerably. So this chart evens all of that out by converting ticket sales into a common currency for comparison purposes. Hats off to Canada's Lottomax on this one - probably due in large part to their 3 line minimum purchase. Note that there are some lotteries not covered in our analysis that perform even better (e.g. Korea, Singapore etc.)
May 2024
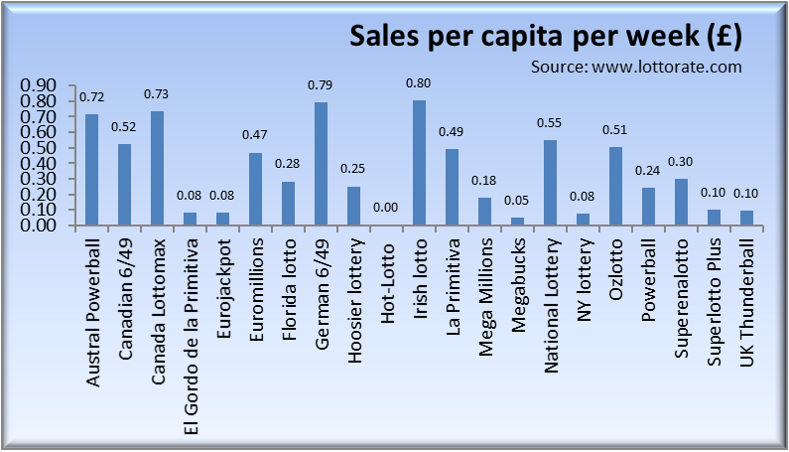
Average ticket sales per capita per week by lottery
And taking this then one last step further forward, what does it look like in terms of average sales per head of population per 'week', as opposed to per draw? Here we need to discount the fact that some lotteries only offer 1 draw per week and others up to 3. This sorts the men from the boys in terms of which lotteries seem to do best and where the biggest Lotto players live. Whilst the US has most of the awards for jackpot sizes, sales per capita per week of either their state or multi-state Lottos aren't up there at the top.
If you'd like to play the best lottos online with our preferred partners, see our reviews of the top lotto websites including details of their pros and cons and our unique lottorating and trust factors. Links to the best sites to play lotteries online are here: Lottoland, Bet365 and thelotter.